

How to Use
INPUT
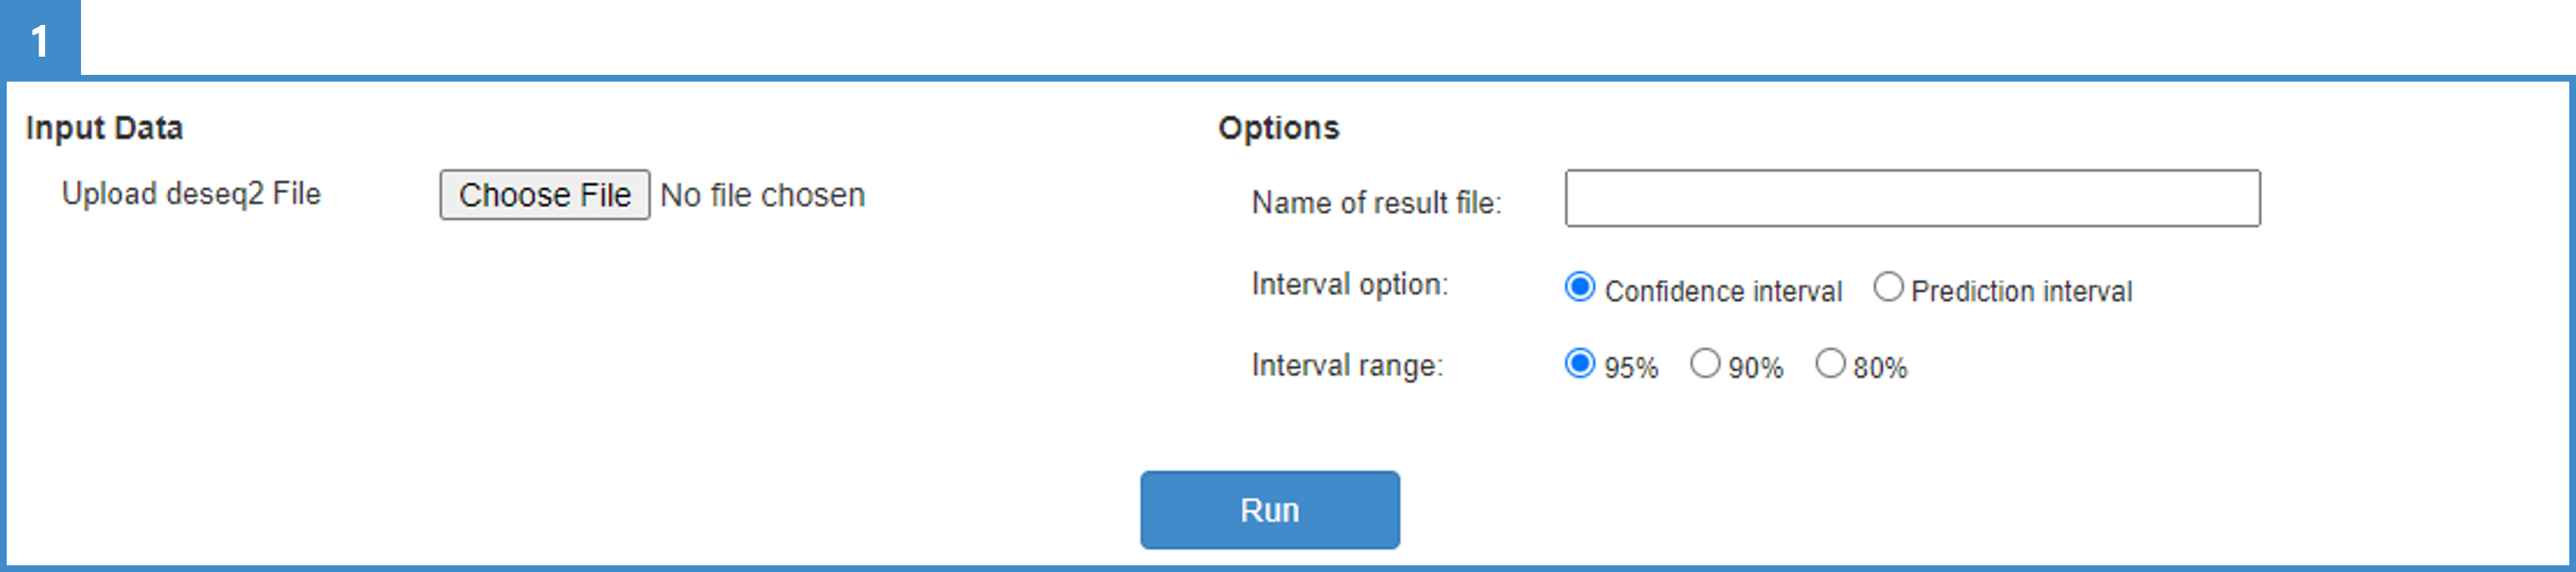
1. Users can currently select RNAseq normalisation via DESeq2 (differential gene-expression analysis) normalisation. To construct DESeq2-based RNAseq input data, first generate RNAseq expression data following an established RNA-sequencing analysis pipeline. Platforms like nf-core offer well-constructed pipelines for RNA sequencing, guiding data transformation from FASTQ to aligned (e.g., STAR) or pseudo-aligned (e.g., Salmon) RNAseq scores. We recommend the STAR-RSEM pipeline. After constructing the expression format, normalise the expression values with the DESeq2 normalisation method (we used DESeq2 v1.34.0).
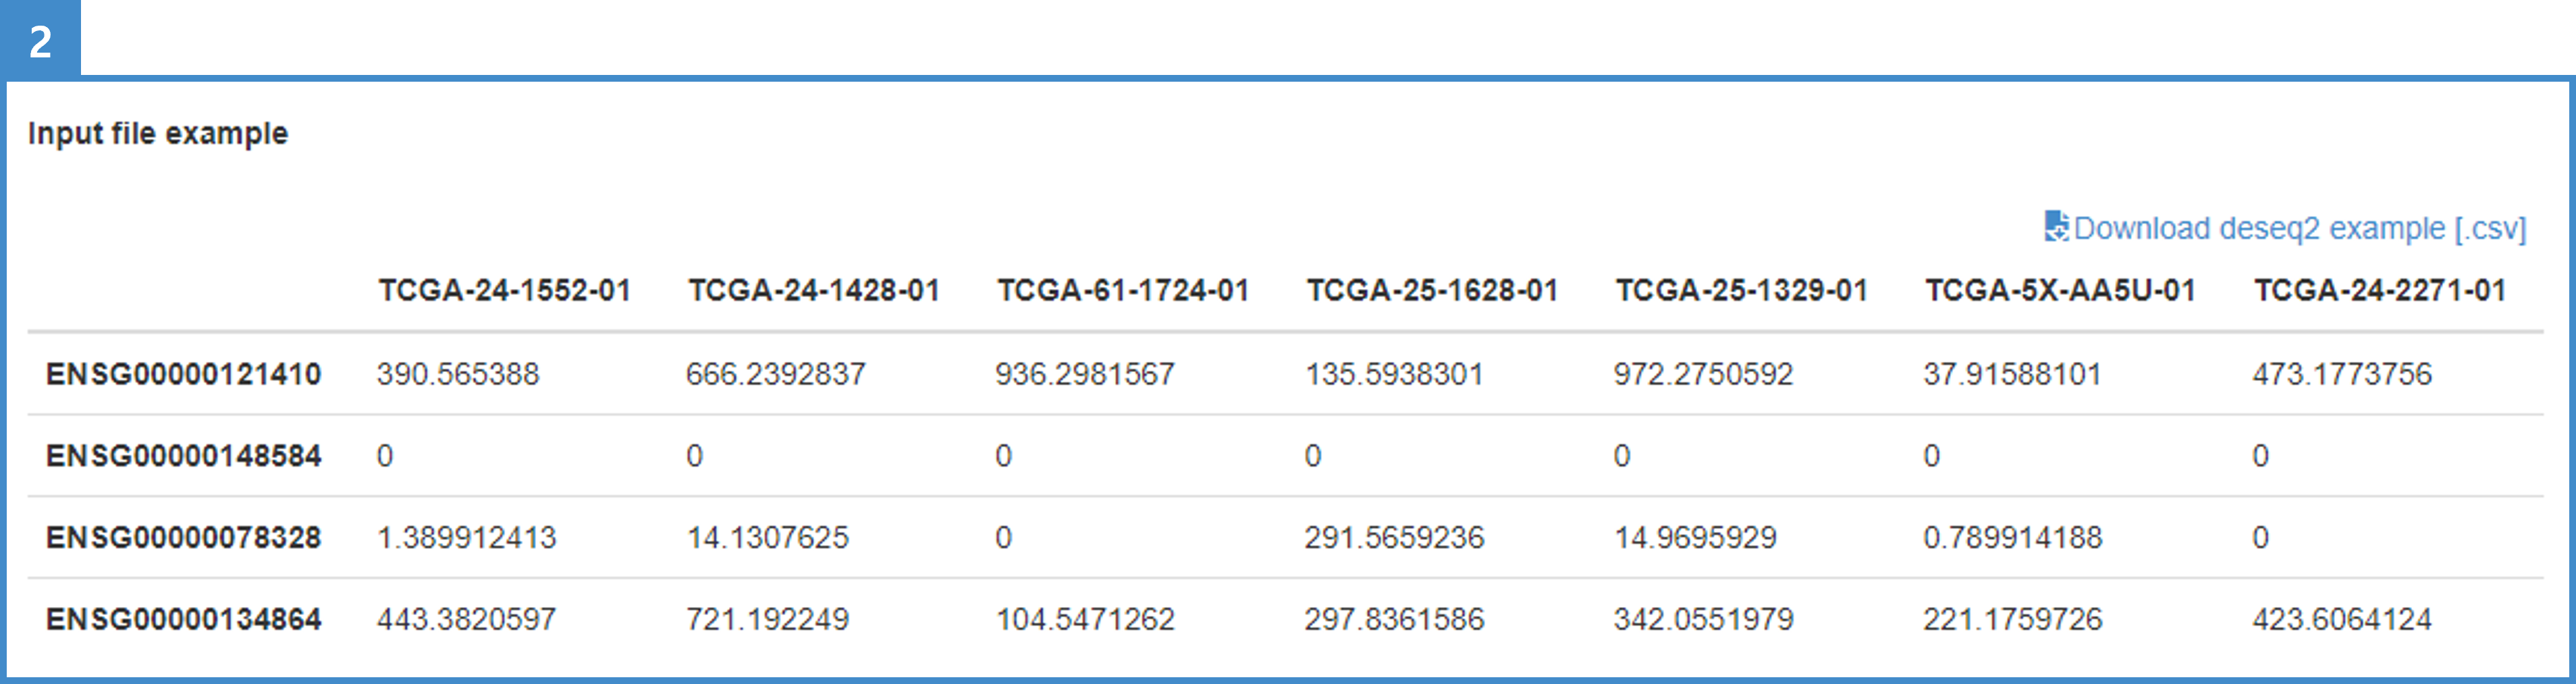
2. The interface provides a comprehensive illustration of the RNAseq format (see the example table, TCGA-OV RNAseq).
3. Download the sample data via the "Download deseq2 example [.csv]" button.
4. Input files must conform to the RNAseq format — Row: genes (ENSEMBL ID); Columns: sample IDs (multiple samples allowed); Value: RNAseq expression in DESeq2 format.
5. Optionally set the name of the result table and select the interval option and range.
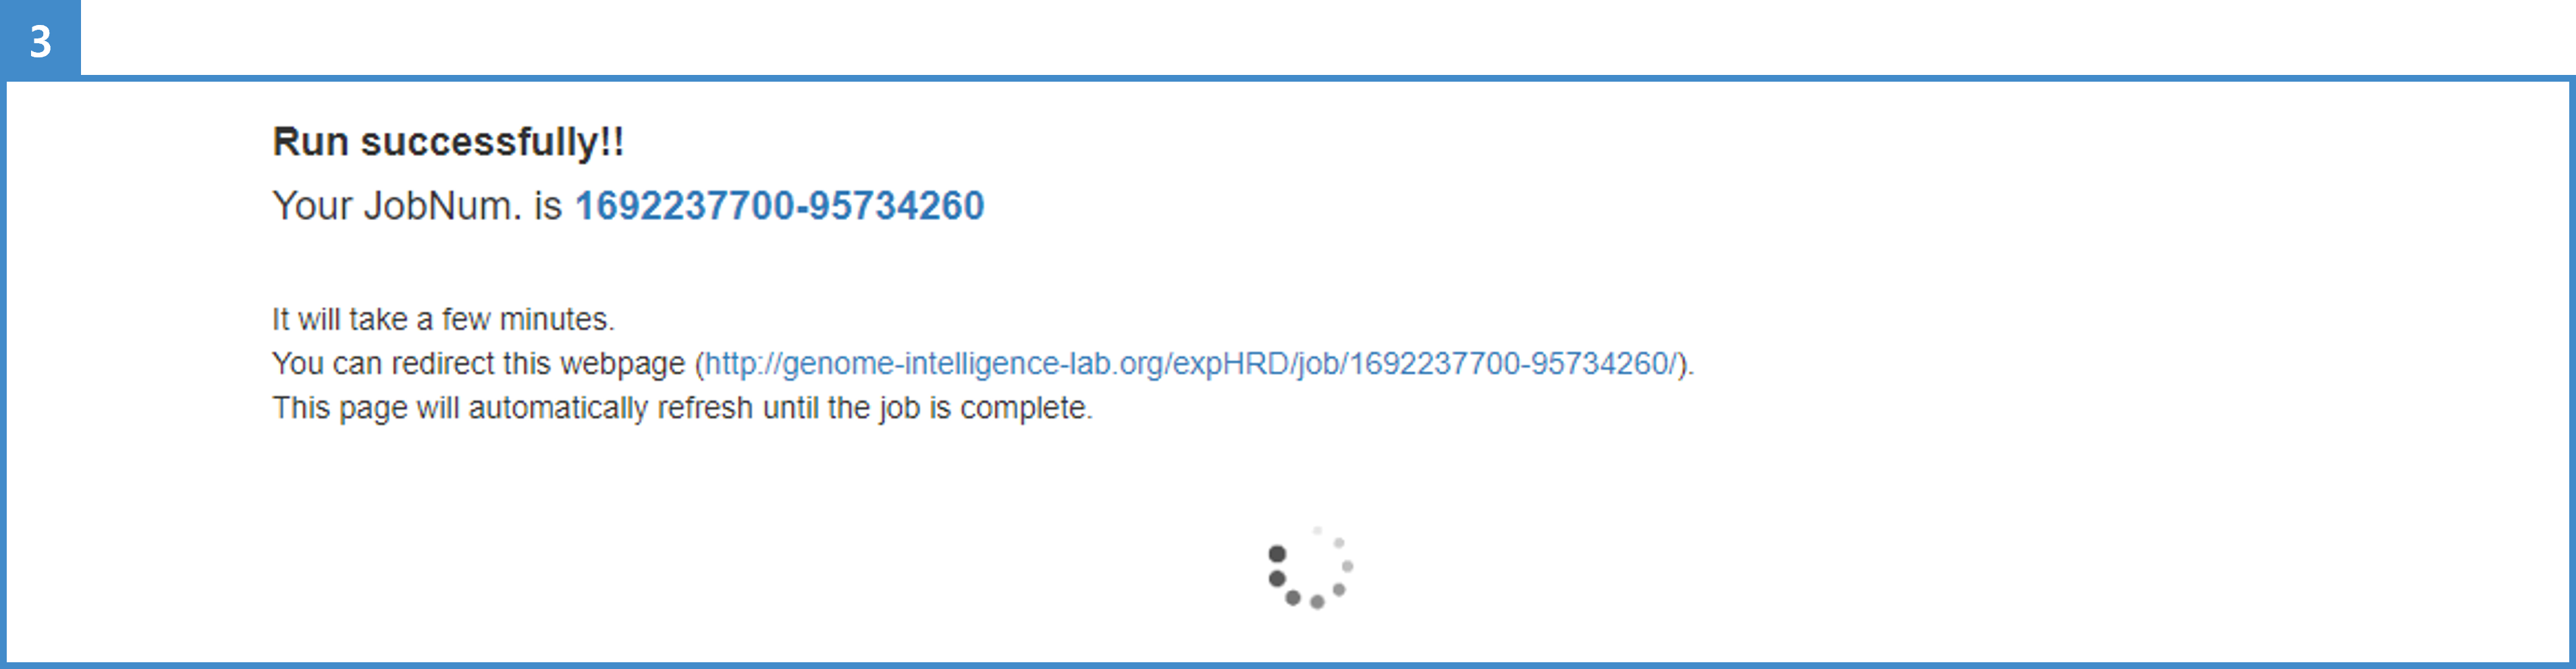
6. Click "Run" and wait until the calculation ends. It may take a few minutes.
OUTPUT

1. Check the summary of expHRD results (input option, output file name, etc.).
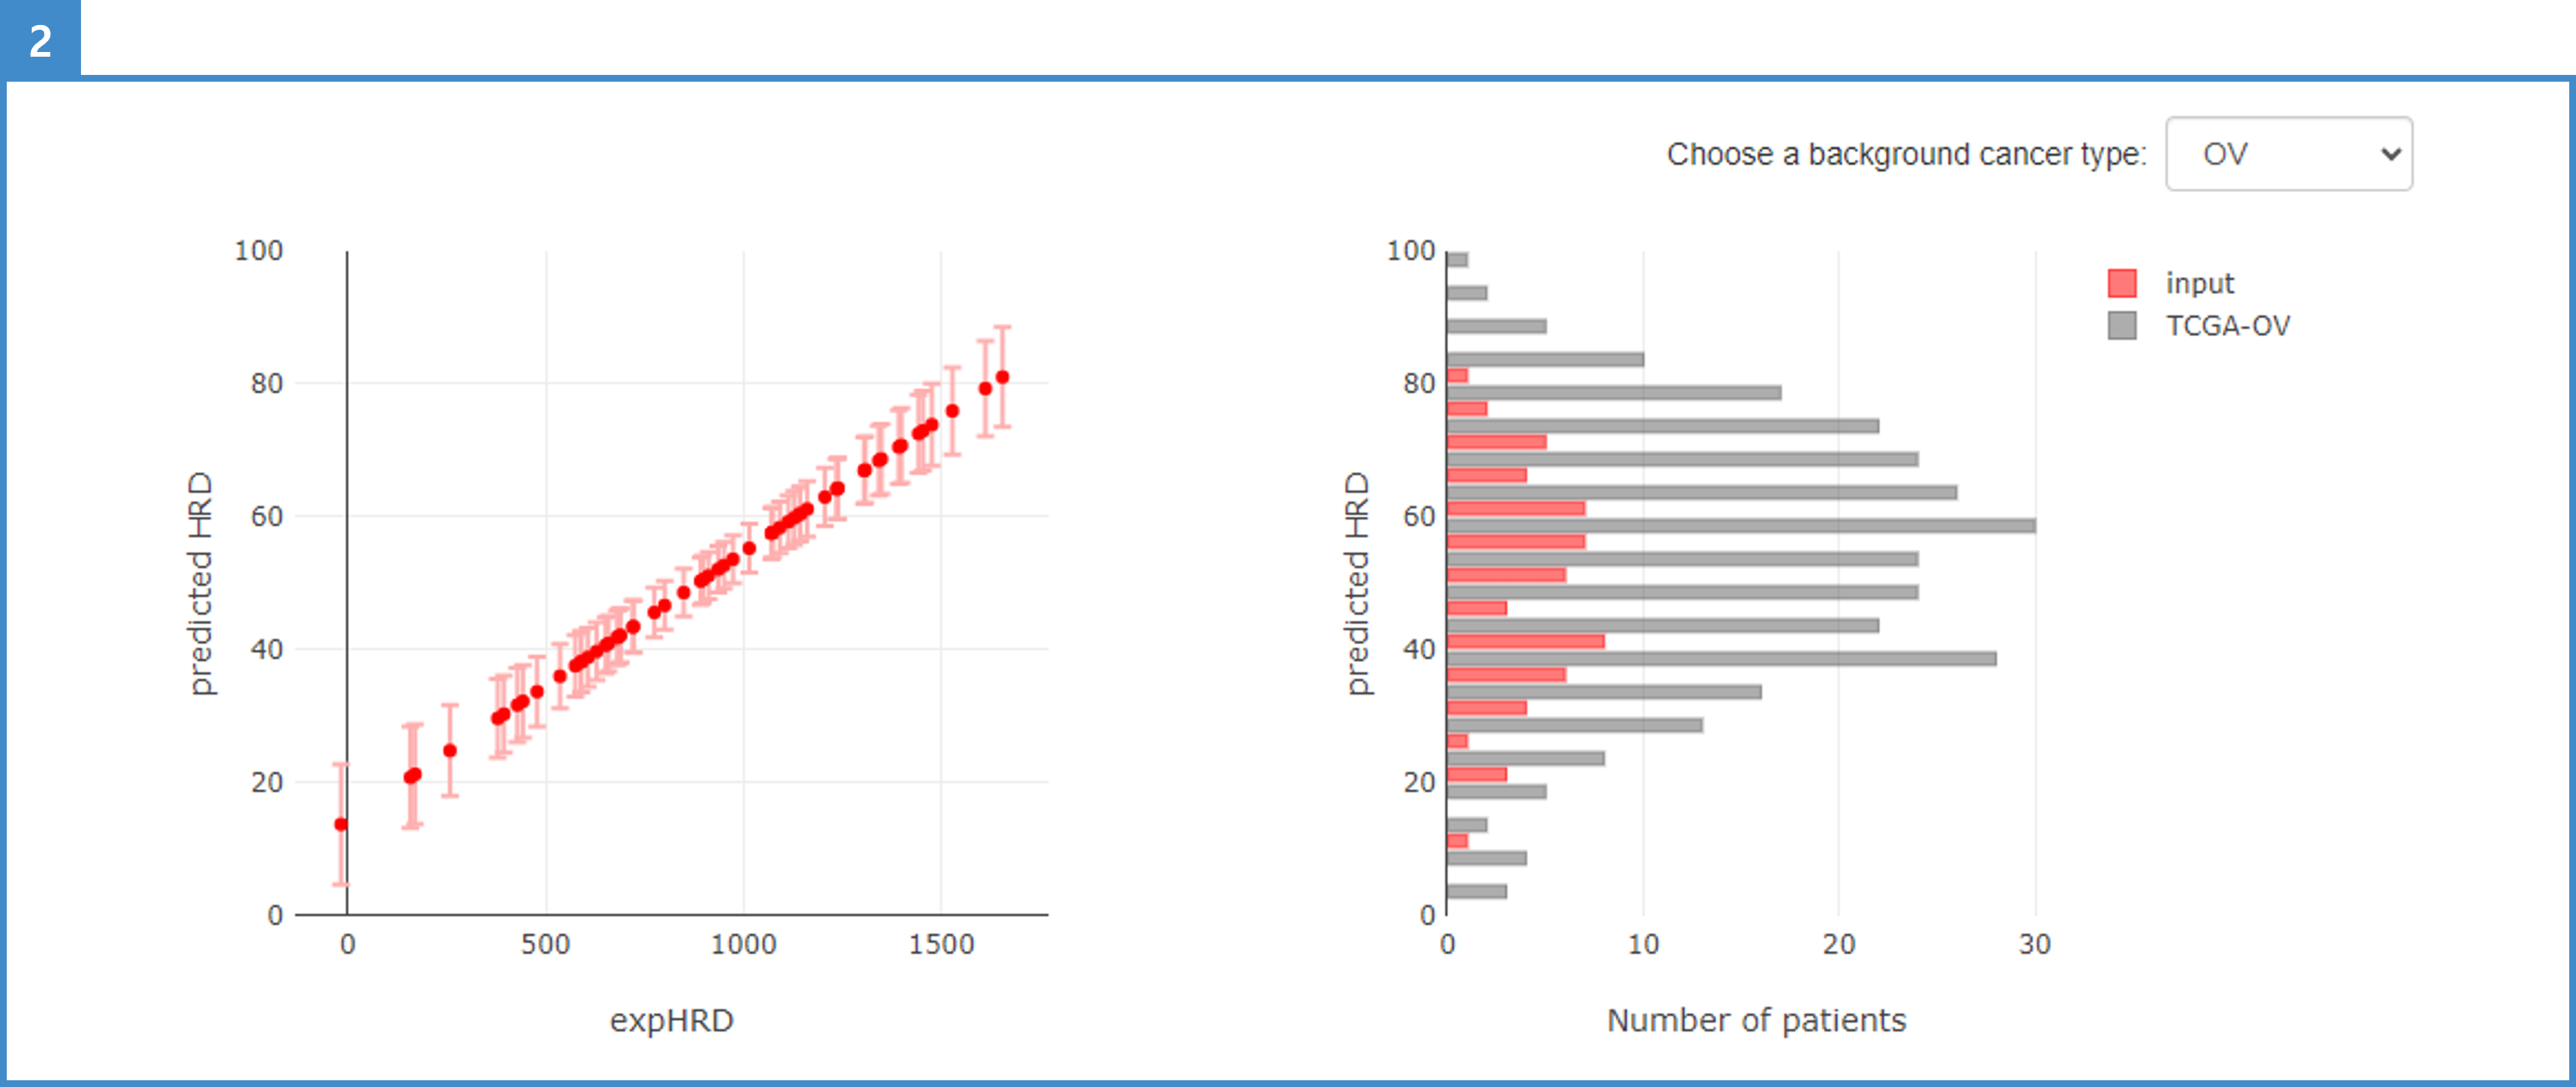
2. The HRD score is plotted following the regression function of the TCGA-OV test sample (left plot). The distribution of HRD scores is plotted as a histogram; choose the background cancer type from the TCGA cohort (right plot).
3. Manipulate the scale, save, or use other Plotly options.
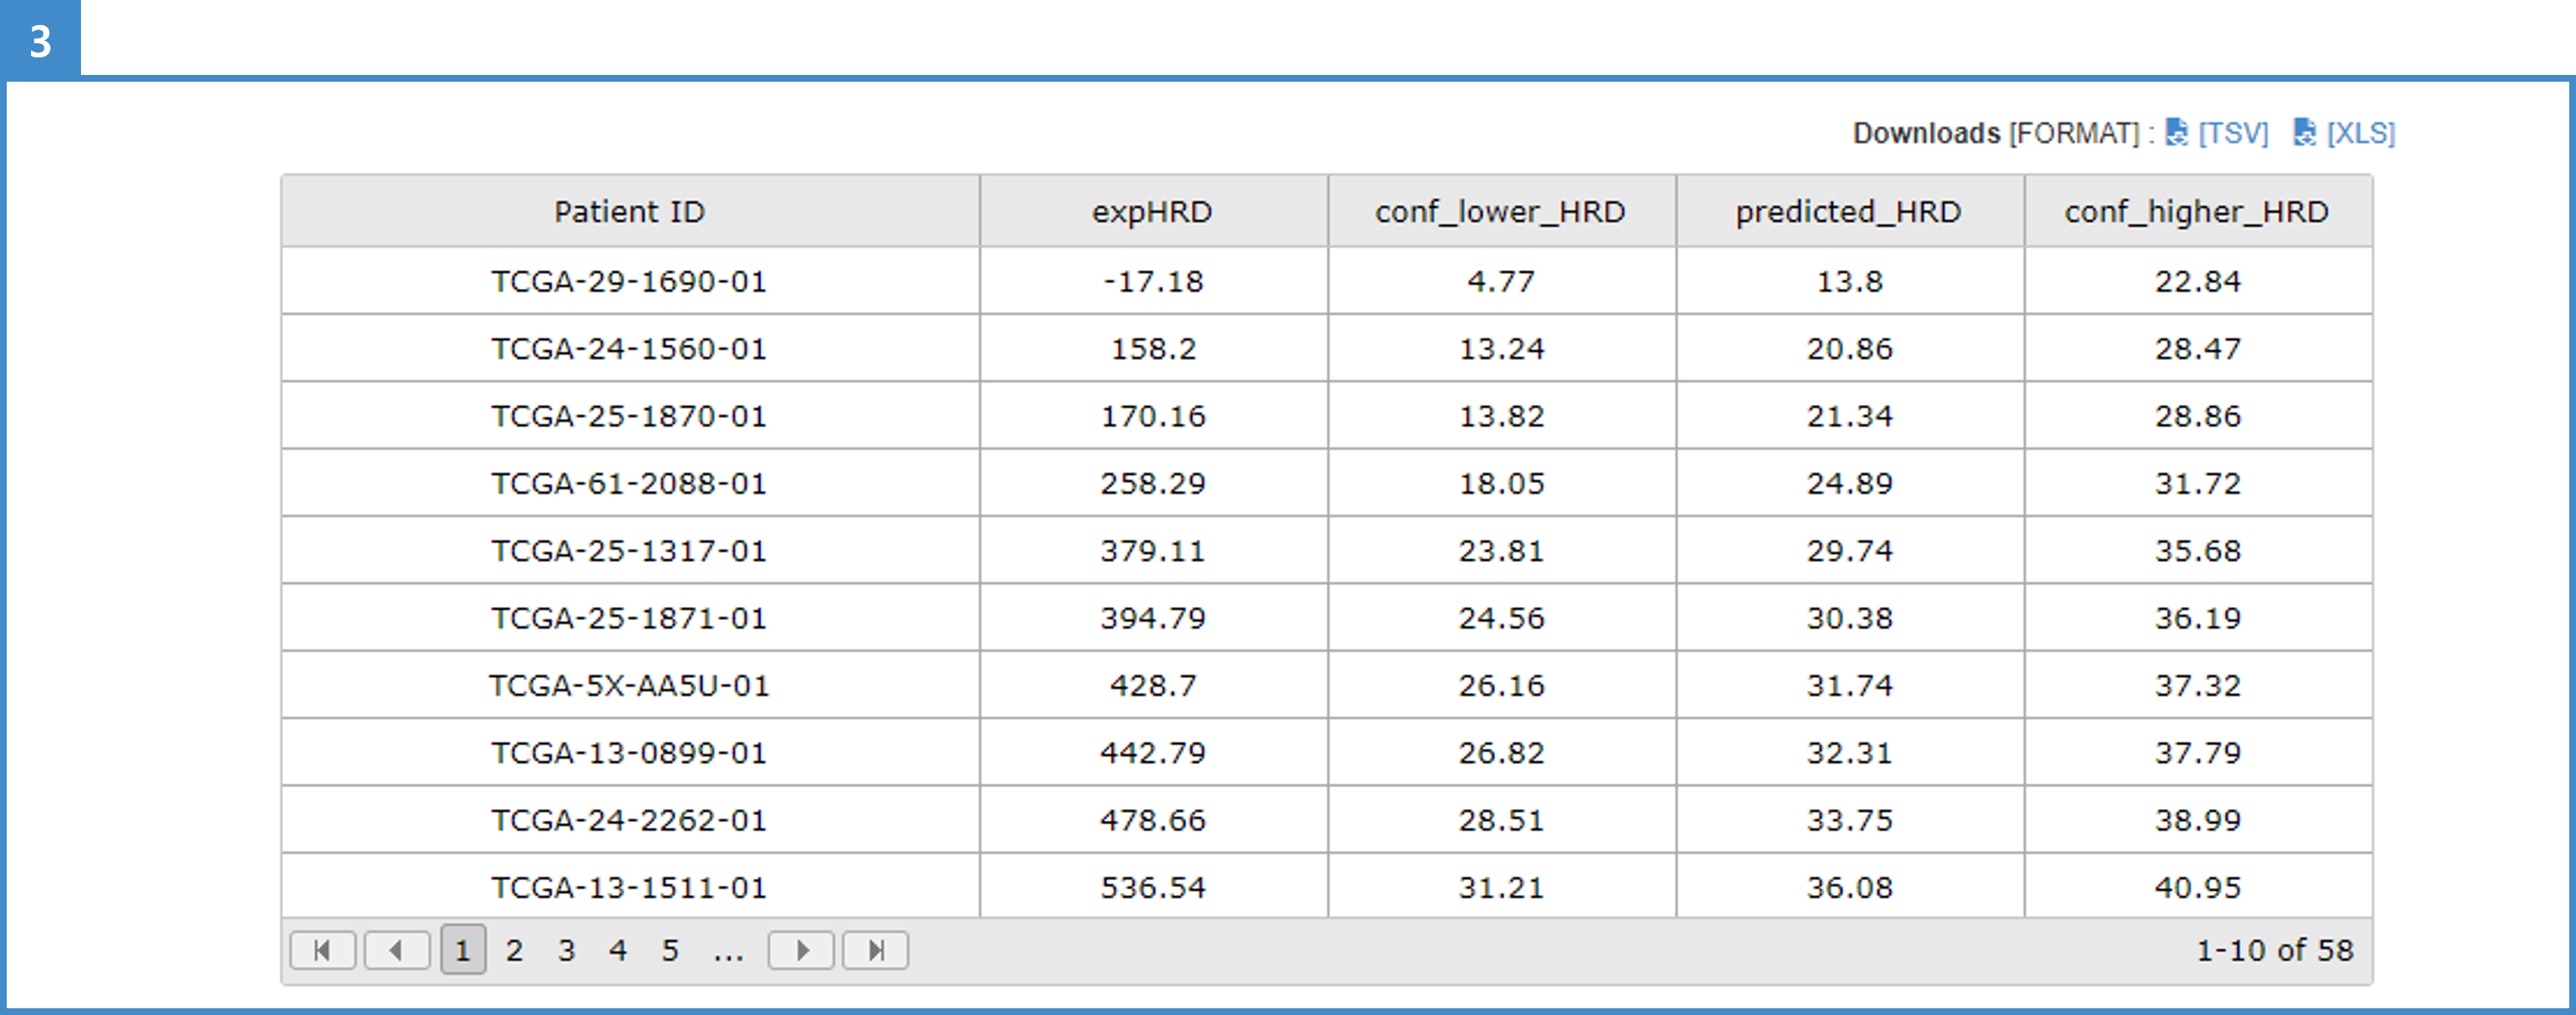
4. The result table shows expHRD, lower HRD, predicted HRD, and higher HRD scores. Lower and higher HRD scores are calculated from the regression function following the selected interval option and range.
5. Download the result table in TSV or XLS format.